BestCashCow recently launched two first of their kind online tools to help borrowers find banks that can provide the loans they need.
BestCashCow recently introduced two first of their kind online tools to help borrowers find banks that can provide the loans they need.
BestCashCow’s Bank Loan FirstStep provides borrowers with the ability to quickly find the top lenders in their local community, state and across the country for major loan categories, including: construction and development, commercial real estate, residential, auto, small business, farm, credit card, and commercial and industrial loans.
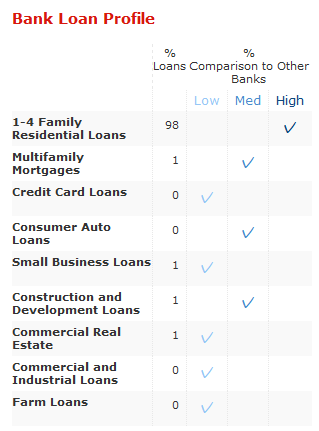
Bank Loan QuickCheck creates a lending profile for every FDIC insured institution that gives consumers an idea of where the bank focuses its lending efforts. The tool also compares lending profiles of banks within each state so that consumers can quickly see which banks stand out in terms of focusing on a certain type of loan category. Users can then contact the individual banks for specific information on loan rates.
"This is an excellent starting point for anyone looking to borrow money," said Sol Nasisi, president of BestCashCow. "For the first time, consumers can access loan profiles for all 7,181 FDIC banks and can compare banks to state averages to find which banks specialize in the types of loans they need. “This will save borrowers time and match them up with the right lenders. It’s a win-win for banks and borrowers."
Bank Loan FirstStep and QuickCheck were created using FDIC data. The company has begun work on extending QuickCheck and FirstStep to credit unions.
Online banks and small community banks have the best savings and CD rates, yet savers are putting more and more money into low rate big banks. BestCastCashCow analysis shows that that consumers across the country, and especially in states like AZ and CA can earn more just by switching their deposit dollars to a smaller, community based bank, or an online bank.
BestCashCow research has shown that smaller banks tend to offer CD rates that are on average .40 - .60 percentage points better than larger banks, while online banks tend to offer savings rates that are on average 0.60 percent better than non-online banks. To see how much potential consumers have to save more by switching accounts, BestCashCow examined the deposit patterns of savers across the country and in each state. The survey showed that despite this fact, consumers across the country have a majority of their money in big banks and offline banks and that trend is only increasing.
The largest banks >$100 billion in deposits have increased their consumer deposit share from 36% before financial crash to 43% today. Larger banks are getting larger while smaller banks are getting smaller or closing. This despite the fact that smaller banks offer better deposit rates. At the same time, Internet banks hold only 6% of total consumer deposits, depsite having some of the best savings rates.
Deposit Share by Size:
Category
2007 Share
2012 Share
< $1 billion
26%
23%
>$1 billion < $10 billion
18%
17%
> $10 billion
56%
59%
> $ 100 billion
36%
43%
States with the Most Deposit Potential
On a statewide basis in 2012, 66% of AZ’s deposits, 64% of Florida’s, and 61% of CA’s deposits are held by mega-banks. As BestCashCow research has demonstrated, large banks (>$10 billion in deposits), have lower rates than smaller banks (<%1 billion in deposits). Consumers in these states would benefit the most from shifting some of their deposits, especially CDs to smaller, community banks.
>100 billion
> 10 billion
< 1 billion
<10 billion > 1 billion
AK
46%
57%
13%
30%
AL
40%
53%
32%
14%
AR
12%
29%
45%
27%
AZ
66%
81%
6%
12%
CA
61%
80%
8%
12%
CO
36%
61%
22%
18%
CT
39%
73%
15%
12%
DC
81%
83%
12%
5%
DE
46%
71%
14%
15%
FL
64%
74%
13%
13%
GA
49%
56%
27%
17%
HI
0%
57%
6%
37%
IA
17%
19%
65%
16%
ID
44%
60%
24%
16%
IL
33%
45%
34%
20%
IN
30%
38%
27%
34%
KS
9%
19%
57%
24%
KY
32%
33%
44%
23%
LA
37%
53%
39%
8%
MA
36%
48%
23%
29%
MD
58%
72%
20%
8%
ME
23%
35%
42%
23%
MI
43%
67%
19%
15%
MN
29%
39%
50%
11%
MO
21%
36%
46%
18%
MS
15%
27%
40%
32%
MT
19%
19%
40%
41%
NC
57%
67%
16%
17%
ND
17%
19%
55%
26%
NE
11%
21%
56%
23%
NH
49%
60%
29%
11%
NJ
51%
72%
11%
16%
NM
36%
52%
44%
5%
NV
66%
72%
7%
21%
NY
56%
77%
9%
14%
OH
39%
65%
21%
14%
OK
6%
20%
50%
30%
OR
52%
72%
11%
16%
PA
30%
57%
21%
22%
RI
51%
66%
14%
21%
SC
44%
49%
26%
25%
SD
19%
21%
51%
29%
TN
33%
44%
40%
16%
TX
38%
55%
28%
17%
UT
36%
70%
28%
2%
VA
58%
60%
18%
22%
VT
0%
52%
28%
20%
WA
48%
64%
13%
24%
WI
14%
39%
46%
16%
WV
23%
31%
36%
33%
WY
19%
26%
49%
26%
States Where Consumers Are Best Maximizing Their Deposit Dollars
IA, NE, and ND have 65%, 56%, and 55% of their deposit dollars in banks with assets under $1 billion. Consumers in these states are best maximizing their deposit dollars based on bank size according to BestCashCow research.
Key Takeaways:
Only 6% of deposits are in online banks, which offer significantly higher savings rates. A large percentage of consumers could benefit by shifting some of their bank savings into online savings accounts. BestCashCow research has also shown that online savings rates have held up better than non-online CD or savings rates over the last year. Consumers should consider looking to online banks to boost yield.
Consumers across all states should consider shifting interest bearing money (especially CDs) from big banks to community banks in order to take advantage of the higher yield. In some states like AZ, and CA, significant money is being left on the table based just on the size bank consumers are choosing.
Belmont Savings Bank has broken ranks with the majority of banks and increased the rate of its PlatinumBlue Savings account from 1.10% APY to 1.15% APY. That's one of the best savings rates in the country.
Belmont Savings Bank has broken ranks with the majority of banks and increased the rate of its PlatinumBlue Savings account from 1.10% APY to 1.15% APY. That's one of the best savings rates in the country. In the process of doing it, they also attached some additional requirements. To receive that savings rate, a depositor must also open a PlatinumBlue checking account that comes with a bevy of free features (free online banking and bill pay, free check images, free ATMs, free mobile deposits). The account has a $25 monthly fee that can be waived with one of the following:
Direct deposit
$2,500 average daily balance
5 debit card transactions (pinned or signature)
5 third party cleared checks per monthly statement cycle
PlatinumBlue Checking also has a $250 initial deposit requirement.
PlatinumBlue Savings is a tiered account and the rate depends on your balance level. The tiers and their respective rates are:
Tier 1: $10.00 - $100,000 - 1.15% APY
Tier 2: $100,001 + : .35% APY
If the requirements are not met on the PlatinumBlue checking account then the savings rate drops to .25% APY for any balance.
Both savings and checking accounts can only be opened in a branch. The offer is only valid to those customers who live near Belmont Savings in Massachusetts.
Belmont Savings Bank is a community bank with $820 million in assets. It's Texas Ratio of 3.04% is well below the national average of 18.73%. A low Texas ratio tends to indicate a financially sound institution.
For savers who don't mind changing their primary checking relationship, or who already have a relationship with Belmont Savings, PlatinumBlue might be a good way to get some extra yield. It's unclear how long the bank will maintain this high rate, so I don't recommend switching unless you are open to a longer-term relationship with the bank and the chance that the savings rate could drop significantly in the future.