
American Flag

Best Online Savings & Money Market Account Rates 2026

Best Online Savings & Money Market Account Rates

Recent Articles


Savings Rates Hit New Lows, CD Rates Flat - Weekly Review

Rate information contained on this page may have changed. Please find latest savings rates.

Savings and CD rates continue to hover at pitiful rates. Average savings rates reached a new record low of 1.51% APY last week, down 3 basis point from 1.54% APY the previous week. Average one-year cd rates actually rose 3 basis points 1.95% APY. Average three-year and five-year CD rates remained steady at 2.67% APY and 3.18% APY respectively.
Last week was nother relatively quiet week in the markets. News was dominated by the devestating earthquake in Haiti as well as the battle over healthcare and the election in Massachusetts. I live in Massachusetts and never in my life have I seen so much campaigning. Usually Massachusetts receives little to no attention in national elections since the race is usually a foregone conclusion. Now, every twenty mintes the phone is ringing with an ad for one candidate or the other and almost every commercial is an election ad.

The stakes are large no matter who wins. Health care eats up 16% of the Federal budget and that number is expected to rise as the cost of healthcare continues to grow at 7-10x the rate of inflation. A friend of mine works in the benefits department of a major corporation and he told me that no matter what happens, the quality of healthcare is going down, or the price is going up. Companies can no longer afford to subsidize as much of the cost. Many of you have already seen it in high-deductible plans or plans with very expensive premiums. Expect this trend to continue.

Now, onto the rates.

CD and Savings Rates

Savings and CD rates continue to hover at pitiful rates. Average savings rates reached a new record low of 1.51% APY last week, down 3 basis point from 1.54% APY the previous week. Average one-year cd rates actually rose 3 basis points 1.95% APY. Average three-year and five-year CD rates remained steady at 2.67% APY and 3.18% APY respectively.

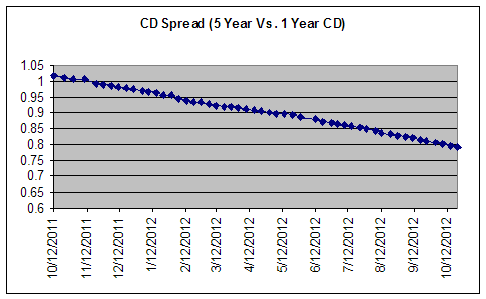
Like the Treasury yield, BestCashCow has developed its own yield ratio for deposit accounts - the spread between savings rates and 36-month CDs. In some ways, this ratio is purer because it cannot be influenced by government debt, Fed Treasury purchase programs, and other attempts to manipulate rates. As you can see below, the ratio between savings accounts (a short duration deposit account) and 3-year CDs is 1.15%. Savings and money market rates have dropped while 3 year cds have essentially stayed flat. The ration remains very elevated, mimicking the Treasury curve. We'll be watching how the ratio develops over the next month to see if it provides any additional clues to the state of the market in 2010.

At this point it's still hard to recommend putting money into anything longer-term than a 12-month CD, especially with rising equity markets and signs that the economy may be coming back to life. Many depositors may be willing to lock money away for 5-years at close to 3%. To me that's just not enough of a return for that period of time. For those worried about interest rate risk, cd laddering may be a good way to smooth out the return you receive from your CD portfolio.
Savings and CD Rate Spreads Widening; Sign of Improving Economic Outlook?

Rate information contained on this page may have changed. Please find latest savings rates.

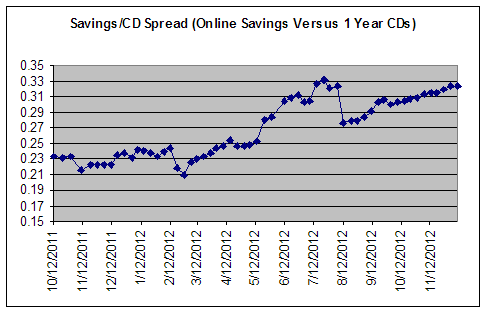
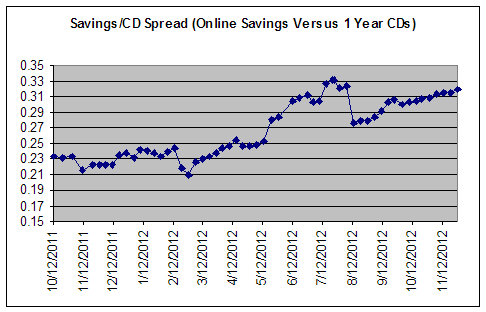
The spread, or difference between the average savings and money market rate and the average 3 year CD rate has been increasing since January. Is this a sign of an improving economy or just a signal that short term deposit rates are horrendously low and going lower?

Sometimes when I'm looking at data and graphs, I feel like I'm taking a rorschack test. "Go ahead," says the Dr., "look at the image and tell me the first thing that pops into your mind."

So a couple of weeks ago, while I was analyzing the most recent CD and savings rate data, this image popped out of Excel.

It shows that starting in March of 2008 (around the time Bear Stearns failed), we saw a significant widening in the spread between money market accounts and longer term Certificates of Deposit. Or, put another way, the difference between the average yield as calculated by the BestCashCow rate tables on a 3 year CD increased versus the average of all savings accounts listed on the BestCashCow rate tables. This spread reached its peak during the week of October 3 (close to the failures of Lehman, AIG, Fannie, Freddie, etc), at which point it began a precipitous decline. It bottomed out during the week of January 23, the same week as President Obama's innaguration. Since then, it has climbed steadily.and is now almost at the pre-crash range.

So, what does this mean? First, we should put this spread into some context. Rates on deposit accounts (savings, money markets, and cds) have been in a steady decline since the financial failures of late September and early October. Starting in that period, the Fed began a series of rate cuts that brought the Fed Funds rate down from 2% to between 0-.25%. The cut in the Fed rate is responsible for much of the drop in deposit rates. But why the significant changes in the spread?

Here's my rorschack interpretation. From March 2008 to September 2008, consumers, business, and the government was concerned about inflation. Oil peaked at over $140 per barrell last summer amid an enormous commodity bubble. In that environment, long-term rates were higher than short term rates on the expection of further prices increases. Banks needed to compensate consumers more for holding their money for longer periods of time amidst high inflation expectations.

And then all of the bubbles popped at once. Short-term rates fell and so did future expectations of inflation. You and I were willing to lock-in a 3 year CD that wasn't much above the rate on savings accounts because we expected rates to drop and inflation to go down with it. I remember writing a lock-in while you can article last September as the economy began its meltdown and the Fed began slashing.

But in January, the dynamic changed. Rates on longer-term CDs (3+ years) began to fall at a slower rate than the shorter duration deposits. I believe this is because the deposit consumer market began to require a bit more for locking their money up. They began to sense that a new government and all of the stimulus on the horizon was going to begin to untangle the financial mess, stoke inflation, and get the economy moving again. And while the Dow crashed again in late February/March, the spread has continued to widen.

The Treasury bill/paper/bond market had been showing the same widening spread until the Fed announched its intention to purchase Treasury bonds. So, in a sense, the deposit yield curve represents an untampered peak into future inflation expectations.

If this holds up, then it may indeed show that expecations of the economy bottomed sometime in January and that we are beginning the slow climb back. Perhaps the stock market rally is for real and that shifting to a concern of inflation may be prudent.

I'll continue to update the chart and of course, I welcome any comments, feedback, or criticism.


Savings and CD Rates Continue Fall Even As Economy Stabilizes

Rate information contained on this page may have changed. Please find latest savings rates.

Savings and CD rates continued to drop over the summer even as the stock market went on one of its longest winning streaks in history, shooting above 9,000 and getting giddy analysts to call for it to rise above the 10,000 mark before long.

August 17, 2009 Update

I wrote the following back in June, before the lazy days of summer:

"Individual bank rates may fall a bit from here but for the most part rates seem to have bottomed, as shown by the chart below. Even savings accounts, the most liquid and sensitive to the Fed Funds Rate (currently at 0%) has flatlined and is no longer on its steep downward slope. Indeed, we've even seen a few banks increase their rates."

Ah, if only that were true. Savings and CD rates continued to drop over the summer even as the stock market went on one of its longest winning streaks in history, shooting above 9,000 and getting giddy analysts to call for it to rise above the 10,000 mark before long.

As the chart below shows, there was nothing to be optimistic about from a savings or cd rate perspective. The average savings account rate according to the BestCashCow rate table is paying 1.8% APY. And those are the top rates in the country! If you walk into Bank of America or Chase, they'll ask you to pay them - practically. Last year at this time, the average savings rate was 3.6% APY. Nothing to write home about but still a lot better than today. The story is much the same with CDs.

The average 12-month CD rate is only slightly better than the savings account rate at 2% APY and banks will pay you 3.22% APY to lock your money in for 5 years.

As the chart below shows, the spread between savings rates and 36-month CD has remained fairly steady over the summer - both have gone down!

So what's a saver to do? With the economy looking like it's on the mend and the Fed and government still pumping trillions, it's hard to justify locking money into a long-term CD. The time to do that was 18 months ago when rates were 5% APY+. For now, I think it's best to stay short-term and wait. An improving economy will force the Fed to eventually raise rates, and that will cause yields to start rising.

The spread between the average BestCashCow savings rates and 36-month CD rates remains steady as the economy stabilizes and investors, banks, and consumers wait to get the next read on where the economy is going.