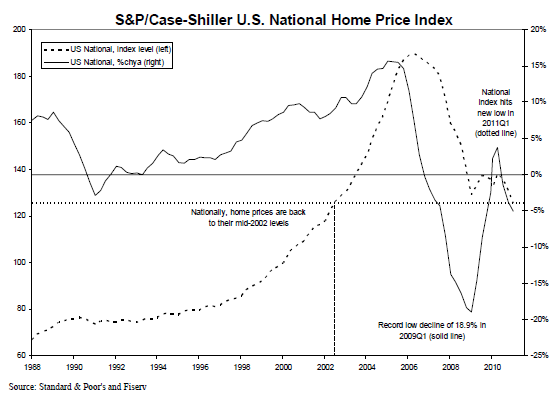
Housing prices continued their fall and are now at mid-2002 levels according to the Case-Shiller Housing Index. Looking at the data, it's appears that we are close to a bottom in the correction. First time home buyers, time to dive in.
Let's look at the data. Below is a graph of Case-Shiller data going back to 1988. You can see the huge runup starting in 1998.

You can see the uptick in 2009-2010 as the government tried to pop up the housing market with incentives. As the incentives have disappeared, mortgages have become more difficult to obtain, and foreclosures continue to come onto the market, prices have moved downward again.
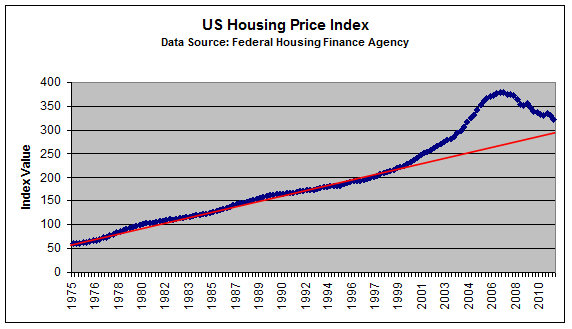
Let's take a step back and look at house appreciation over a greater period of time. I graphed data available fromthe Federal Housing Finance Agency.

As you can see, the data starts in 1975 and more clearly shows the slope steepening, starting in 1998. Like everything in the world, what comes up, comes back down. And housing has come down.
To better determine how much we can expect housing to come down, I manually added a line of best fit - the red line. It shows where housing might be if prices had followed normal growth trends. We are approaching an intersection with that red line, meaning housing has fallen back to the level we would expect with a "normal" growth rate.
Conclusion
Based on this data, I believe that prices are almost done correcting from the huge run-up over the past ten years. That doesn't mean housing can't go below the red line though. A lack of mortgage availability, a change in the mortgage interest deduction, and the general economy will all impact housing prices. But for now, the huge price gains we saw over the past decade are gone.


Add your Comment
use your Google account
or use your BestCashCow account