I’m almost sure you know of at least one person who got laid off or is unemployed and desperately looking for work. Such has been the economic disruption we’ve faced that it’s an all too familiar and depressing reality to know someone like that.
It’s generally accepted amongst the economic and investment community that the greatest challenge the United States faces in the next couple of years is the threat of high and stubborn unemployment. The precise definition of unemployment is the “number of people within the economically active population (people between 15-65 years), who are willing to work, looking for a job, but unable to find a job.”
According to the Department of Labor Statistics, unemployment across the nation is currently standing at 9.7% (not seasonally adjusted). This is the figure most people use to gauge at what level the unemployment rate sits. Of course this being a national average, some states have different rates than others. New York State, for example, has a November 2009 unemployment rate of 8.4%. This compares to Texas at 7.9%, Massachusetts at 8.3% and New Jersey at 9.1%. California is at 12.2% while Michigan is facing a mammoth 14.1% unemployment rate. That’s not totally surprising given what’s been going on in the automobile manufacturing industry.
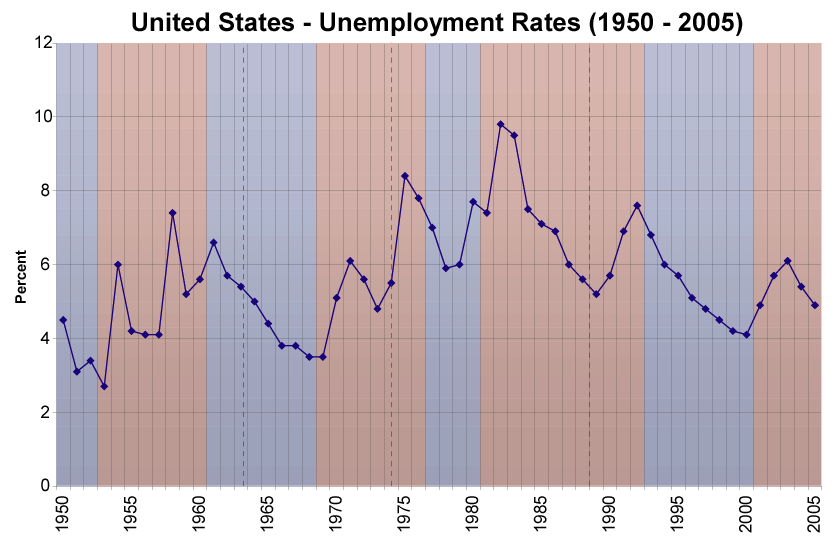
The unemployment rate in the US has trended around 5% since 1950, as seen in this graph. This means that unemployment at the moment is almost twice the 50-year average. With a labor force at 153 million, according to the US Department of Labor, an approximate 15 million people are unemployed. That’s 14.8 million buyers of food, shelter, cars, clothing and services excluded from the economy and with decreasing if not zero purchasing power. Based on an estimated GDP per capita of $45,800, and assuming 5% structural unemployment exits, one can then very simplistically assume that $343 billion in income and spending power potential has been lost. That’s about 2.8% of GDP gone.
How did we get into this mess? Economic theory, and most prominently Keynesian economics, says unemployment results from insufficient demand for goods and services in the economy. This is referred to as cyclical unemployment. However some other leading theorists suggest structural problems and inefficiencies inherent in labor markets, such as disequilibrium between demand and supply caused by globalization or new technologies. Classical economics explains unemployment in terms of external factors such as minimum wage laws, taxes, unionization, and other stringent regulations. Other theories also exist which you can read more about here.
While the situation is dire there is one key factor that many investors are overlooking when it comes to unemployment numbers. Persons are classified as unemployed if they do not have a job, have actively looked for work in the prior 4 weeks, and are currently available for work. Actively looking for work includes contacting potential employers or a job agency, sending out resumes and placing ads. Attending a job training program or course is not considered an active pursuit of employment.
Let’s look at two examples. John Jones is 16 years old, and he has no job from which he receives any pay or profit. However, John does help with the regular chores around his father's farm and spends about 20 hours each week doing so.
Secondly, Megan Hunt spends most of her time taking care of her home and children, but she helps in her husband's computer software store all day Friday and Saturday.
Despite neither earning any income, according to the Government's definition of employment, both John and Megan are considered employed. They fall into a group called "unpaid family workers," which includes any person who worked without pay for 15 hours or more per week in a family-owned enterprise operated by someone in their household.
Another distortion in the unemployment number can be explained using this hypothetical example: Bill Smith was thinking about looking for work in the prior 4 weeks but has not made any specific efforts to do so. Bill does not meet the activity test for unemployment and is, therefore, counted as not in the labor force. He would be referred to as a discouraged worker. He is then not counted as unemployed.
Obviously from any practical point of view these people are unemployed but not counted as such. They may be in their respective positions due to lack of choice, lack of opportunity or due to the fact that they have been searching and found nothing.
So what does this all mean?
The official unemployment rate grossly understates the actual number of people who, by all realistic measures, are unemployed. It’s very hard to come up with a reliable figure as it’s almost impossible to count all these people accurately. Estimates, however, range from 16% all the way to a gigantic 17.5% ! The Wall Street Journal reckons it’s at about 16.8%!
Realistically speaking we are looking at an unemployment rate of closer to 16.5% than the 9.7% we’ve been getting officially. Using my above calculations the situation is dire – around $600 billion in lost income and spending, closer to 5% of the economy.
When anybody comes out with news that the unemployment rate is dropping, bear in mind the stark contrast between economic theory (9.7%) and reality (16.5%).


Comments
Sean Riskowitz
February 24, 2010
Check out this CNBC article detailing exactly what I discussed above: http://www.cnbc.com/id/35535193
Is this review helpful? Yes:0 / No: 0
Add your Comment
use your Google account
or use your BestCashCow account